Live data
Current admissions figures are available whenever the team needs them.
02 / International School
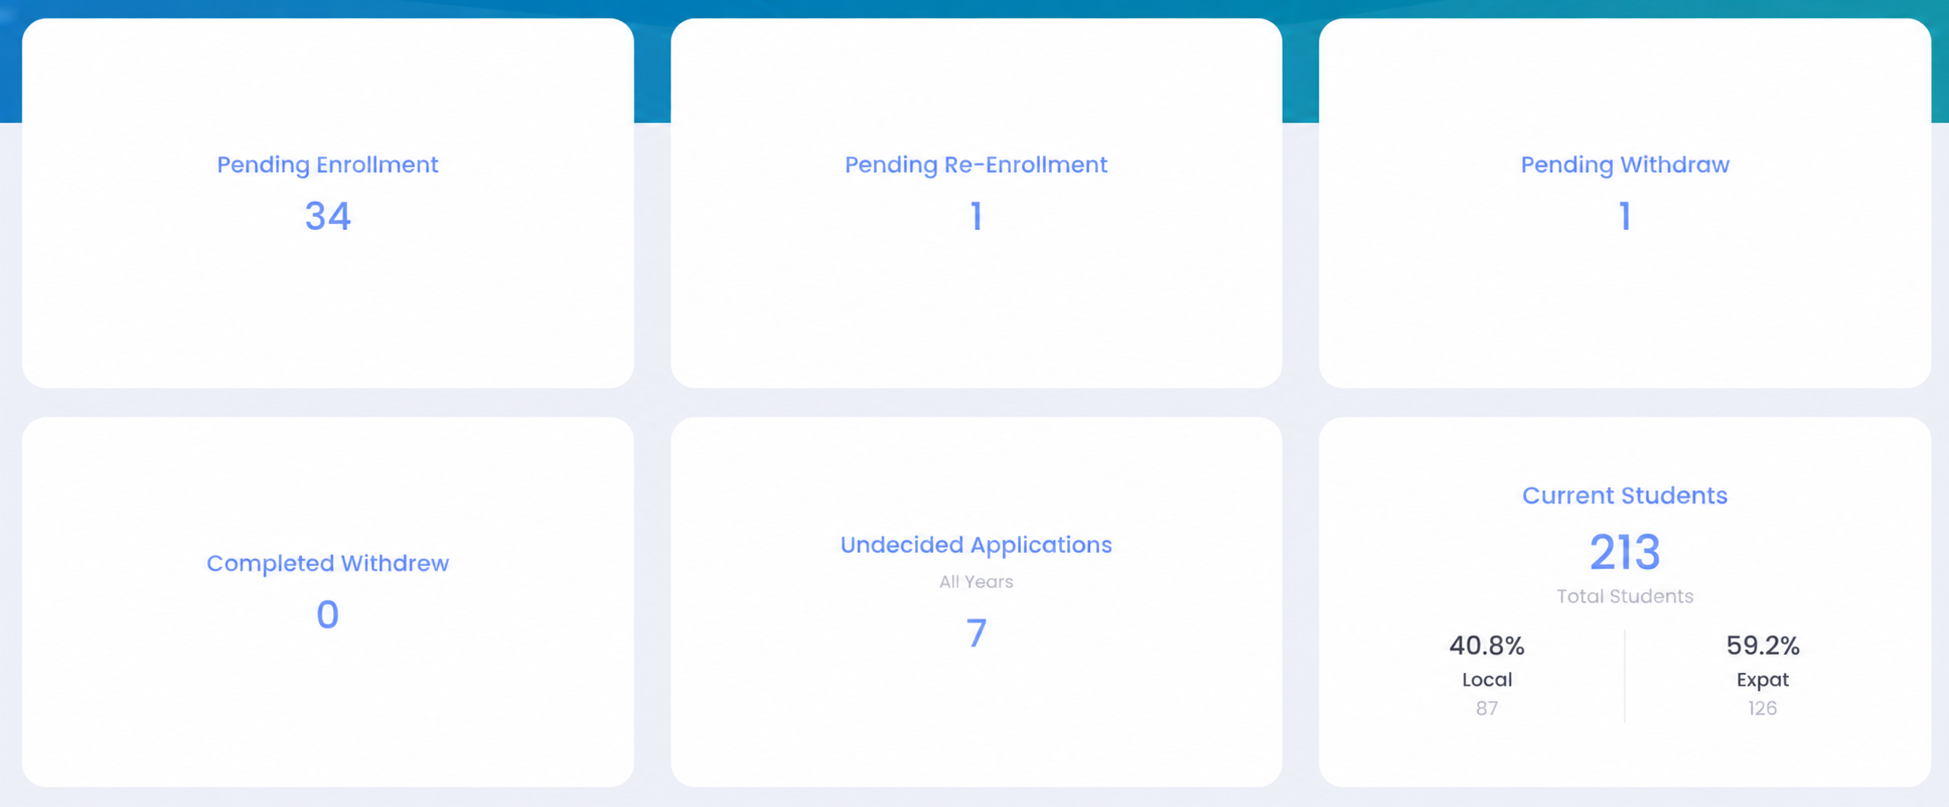
A spreadsheet-heavy admissions process became a live dashboard that analyzes the data automatically and gives the school accurate numbers at a glance.
The problem
The admissions team relied on Excel spreadsheets and manual calculations to understand enrollment activity. Producing an overview took time, created opportunities for counting errors, and made it difficult to see the latest position immediately.
What changed
SchoolOptimize transformed the underlying admissions data into a clear school admissions dashboard. Enrollment, re-enrollment, withdrawal, application, and current-student figures are organized and calculated automatically in one view.
The solution
Instead of rebuilding reports from multiple Excel sheets, the admissions team can see live enrollment analytics and consistent totals at a glance. This reduces manual counting, improves reporting accuracy, and helps school leaders make decisions using current data.
Current admissions figures are available whenever the team needs them.
Automated calculations reduce the risk of manual counting errors.
Important enrollment stages and student totals are visible together.
Staff spend less time assembling reports and more time acting on the data.
Still assembling critical numbers by hand?
Let's automate it